

What Drives Used Construction Equipment Values and Why It Matters
Imagine listing a wheel loader for sale and receiving an offer that feels insultingly low, or buying an excavator only to discover you overpaid by tens of thousands of dollars. Both scenarios happen every day, and they share a common root cause: a misunderstanding of how used construction equipment values actually work.
Whether you are a contractor budgeting for your next project, a fleet manager deciding which machines to keep and which to disposition, a dealer pricing trade-ins, or a lender underwriting an equipment loan, the number you assign to a pre-owned machine shapes every financial decision downstream. Get it wrong, and the ripple effects hit your balance sheet, your tax filings, and your negotiating leverage.
This guide is built to be the consolidated reference that covers what no single resource typically addresses in one place: weighted valuation factors, category-specific depreciation curves, emissions-tier pricing impacts, regional market variance, and a neutral comparison of every major data source and equipment calculator available. Think of it as your playbook for reading the used iron market with confidence.
What Are Used Construction Equipment Values
Used construction equipment values represent the estimated monetary worth of pre-owned machines, including excavators, loaders, bulldozers, and skid steers, determined by factors such as age, operating hours, mechanical condition, market demand, and geographic location. The valuation process considers multiple variables holistically, much like a professional equipment appraisal that weighs both market comparables and asset-specific condition data to arrive at a defensible number.
You will notice that this definition intentionally avoids naming a single dollar figure. That is because the same machine can carry several legitimately different price tags depending on the transaction context, the valuation method, and even the region where the sale takes place. A 2019 mid-size excavator sitting on a dealer lot in Texas carries a different retail asking price than the same unit hammered down at a liquidation auction in the Midwest.
Why Accurate Valuation Matters Across Every Transaction
An inaccurate valuation does not just cause frustration; it costs real money. Sellers who underprice their iron leave profit on the table. Buyers who overpay erode project margins before a single bucket of dirt moves. Insurers who undervalue a machine expose the policyholder to a coverage gap, while lenders who overvalue collateral take on unnecessary risk. Even tax reporting suffers, since depreciation schedules built on flawed starting values cascade errors through years of filings.
Throughout this article, you will encounter multiple valuation contexts, each producing a different but legitimate number for the same piece of equipment:
- Auction price - what the machine fetches on the auction floor
- Dealer retail price - what a dealer asks after reconditioning
- Private-sale fair market value - the agreed price between a willing buyer and seller
- Trade-in value - the credit a dealer offers toward new equipment
- Insurance replacement value - the cost to replace with a comparable machine
The same machine can carry several legitimately different price tags depending on the transaction context. Quoting a single number without specifying which valuation type it represents is the most common source of confusion, disputes, and lost dollars in the used equipment market.
Understanding these distinctions, and knowing which industrial equipment price comparables to pull for your specific situation, is the difference between negotiating from strength and negotiating blind. The sections ahead break down each valuation type, the factors that weight them, and the tools you can use, from subscription databases to free auction results, to pin down the right number before money changes hands.
Five Valuation Types That Produce Different Price Tags
Picture this: you ask three people what your skid steer is worth. Your accountant gives you one figure, a dealer quotes another, and an auction rep offers a third, noticeably lower number. Nobody is lying. They are simply answering different questions, and each answer points to a different valuation type. Confusing these types is where costly mistakes begin, so let's break them apart.
Book Value vs Fair Market Value vs Liquidation Value
Book value is the number that lives on your balance sheet. It starts at the original purchase price and decreases over time as your accountant applies depreciation, typically following IRS schedules or your company's internal policy. Book value is useful for financial reporting and tax purposes, but it rarely reflects what a machine would actually sell for in today's market. A well-maintained excavator might carry a book value near zero after several years of aggressive depreciation, yet still command a strong resale price.
Fair market value, or FMV, answers the question most people actually mean when they ask, "What is this machine worth?" It represents the price a willing buyer and a willing seller would agree upon in an open market, with both parties having reasonable knowledge of the relevant facts and neither under pressure to act. FMV assumes the equipment is marketed in a commercially reasonable way and given adequate exposure to qualified buyers. This is the benchmark you want for private sales, financing discussions, and most equipment valuation scenarios where time is not a constraint.
Liquidation value sits at the opposite end of the spectrum. It estimates what a machine will bring when the seller must move it under tighter time or market constraints, such as a plant closure, debt workout, or rapid surplus reduction. There are actually two flavors here. Orderly liquidation value assumes some time remains to organize the sale, line up buyers, and market the asset, while forced liquidation value applies when the sale must happen immediately, with compressed marketing and minimal negotiation leverage. In either case, the result is typically the lowest price a machine will fetch.
When does each apply? Use book value for accounting and tax filings. Rely on FMV for private sales, equipment loans, and portfolio reviews. Turn to liquidation value when speed or certainty of sale matters more than maximizing price, such as auction planning or distressed dispositions.
Dealer Retail Value, Trade-In Value, and Insurance Replacement Value
Dealer retail value is the asking price you see on a dealer's lot or website. It factors in the cost of reconditioning, any warranty or guarantee the dealer provides, overhead, and a profit margin. Because the dealer absorbs risk and adds value through inspection and refurbishment, this figure runs higher than what you would pay in a private-party transaction. If you have ever used a tractor value calculator or a skid steer value calculator and then compared the output to a dealer's sticker price, the gap you noticed is largely explained by these added costs.
Trade-in value is what a dealer credits you when you swap an older machine toward a new or newer purchase. Think of it as the wholesale side of the dealer equation. The dealer needs room to recondition and resell your trade-in at a profit, so trade-in value typically falls below private-sale FMV. It is convenient and eliminates the hassle of finding your own buyer, but that convenience comes at a price discount.
Insurance replacement value, sometimes called replacement cost value, answers a different question entirely: "How much would it cost to replace this machine with one of comparable make, model, age, and condition right now?" Because it accounts for current market pricing and sourcing effort, replacement cost coverage often produces the highest figure among all valuation types. Insurers may also use actual cash value, which deducts depreciation from replacement cost, resulting in a lower payout. Understanding whether your policy pays on a replacement-cost or actual-cash-value basis directly affects how much you recover after a loss.
The table below puts all five valuation types side by side so you can compare at a glance.
| Valuation Type | Definition | Typical Use Case | Relative Price Level |
|---|---|---|---|
| Insurance Replacement Value | Cost to replace with a comparable machine at current market prices | Insurance claims, coverage planning | Highest |
| Dealer Retail Value | Asking price on a dealer lot, includes reconditioning, warranty, and overhead | Retail purchase from a dealer | High |
| Fair Market Value (FMV) | Price agreed upon by a willing buyer and seller in an open, unpressured market | Private sales, financing, portfolio reviews | Medium-High |
| Trade-In Value | Credit a dealer offers toward a new purchase | Equipment trade-ins, fleet upgrades | Medium |
| Book Value | Depreciated cost carried on financial statements | Accounting, tax reporting | Varies (accounting-driven) |
| Liquidation Value | Expected price under time-constrained or forced-sale conditions | Auctions, closures, distressed sales | Lowest |
Notice how the spread from top to bottom can be dramatic. A used tractor value calculator might spit out a fair market figure, but if you are comparing that number to a dealer's retail listing, you are looking at apples and oranges. The same disconnect happens when a seller anchors to insurance replacement value while the buyer is thinking in auction-floor terms.
The single most important habit you can build is specifying which valuation type a number represents every time you discuss price. Dropping that context is where disputes start, deals collapse, and thousands of dollars slip through the cracks. With the valuation vocabulary locked in, the next logical step is understanding which factors actually move these numbers up or down, and how much weight each one carries relative to the others.
Key Value Factors and How to Weight Them
Every used machine is shaped by dozens of variables, but not all of them carry equal weight. Two excavators can share the same model year, sit in the same zip code, and still trade at prices thousands of dollars apart because the factors that actually drive machinery valuation are not created equal. Knowing which levers move the needle most, and by roughly how much, gives you an actionable mental model for pricing any piece of iron you encounter.
Think of the process less like checking boxes and more like adjusting a mixing board: some sliders have a massive impact on the final output, while others fine-tune the result. The framework below ranks those sliders from highest impact to lowest so you can focus your due diligence where it matters most.
Brand, Model, and Configuration Weighting
Manufacturer reputation is one of the heaviest thumbs on the scale. Brands like Caterpillar, Komatsu, John Deere, and Volvo consistently command higher resale prices, and the reason is straightforward: buyers trust the availability of dealer support, parts supply chains, and trained technicians. A lesser-known brand can deliver solid field performance, yet sellers often need to lower prices to draw interest, even when the machine is in good condition.
Model popularity matters just as much as the badge on the hood. A mid-size excavator in a widely used weight class, say 20 to 25 metric tons, typically retains value better than a niche-size unit simply because the buyer pool is larger. When you search a construction equipment values blue book or log in to an EquipmentWatch database, you will notice that popular models generate far more comparable transactions, which in turn makes their valuations more reliable.
Configuration and factory-installed options add another layer. A machine that left the factory with a high-flow auxiliary hydraulic circuit, a pattern-change valve, or a cold-weather package appeals to a broader range of buyers than a bare-bones unit. These options can account for a meaningful slice of the value gap between two otherwise identical machines, so always document original-equipment specifications when preparing a listing or running a Source 2 machinery fair market value analysis.
Operating Hours, Age, and Condition as Core Multipliers
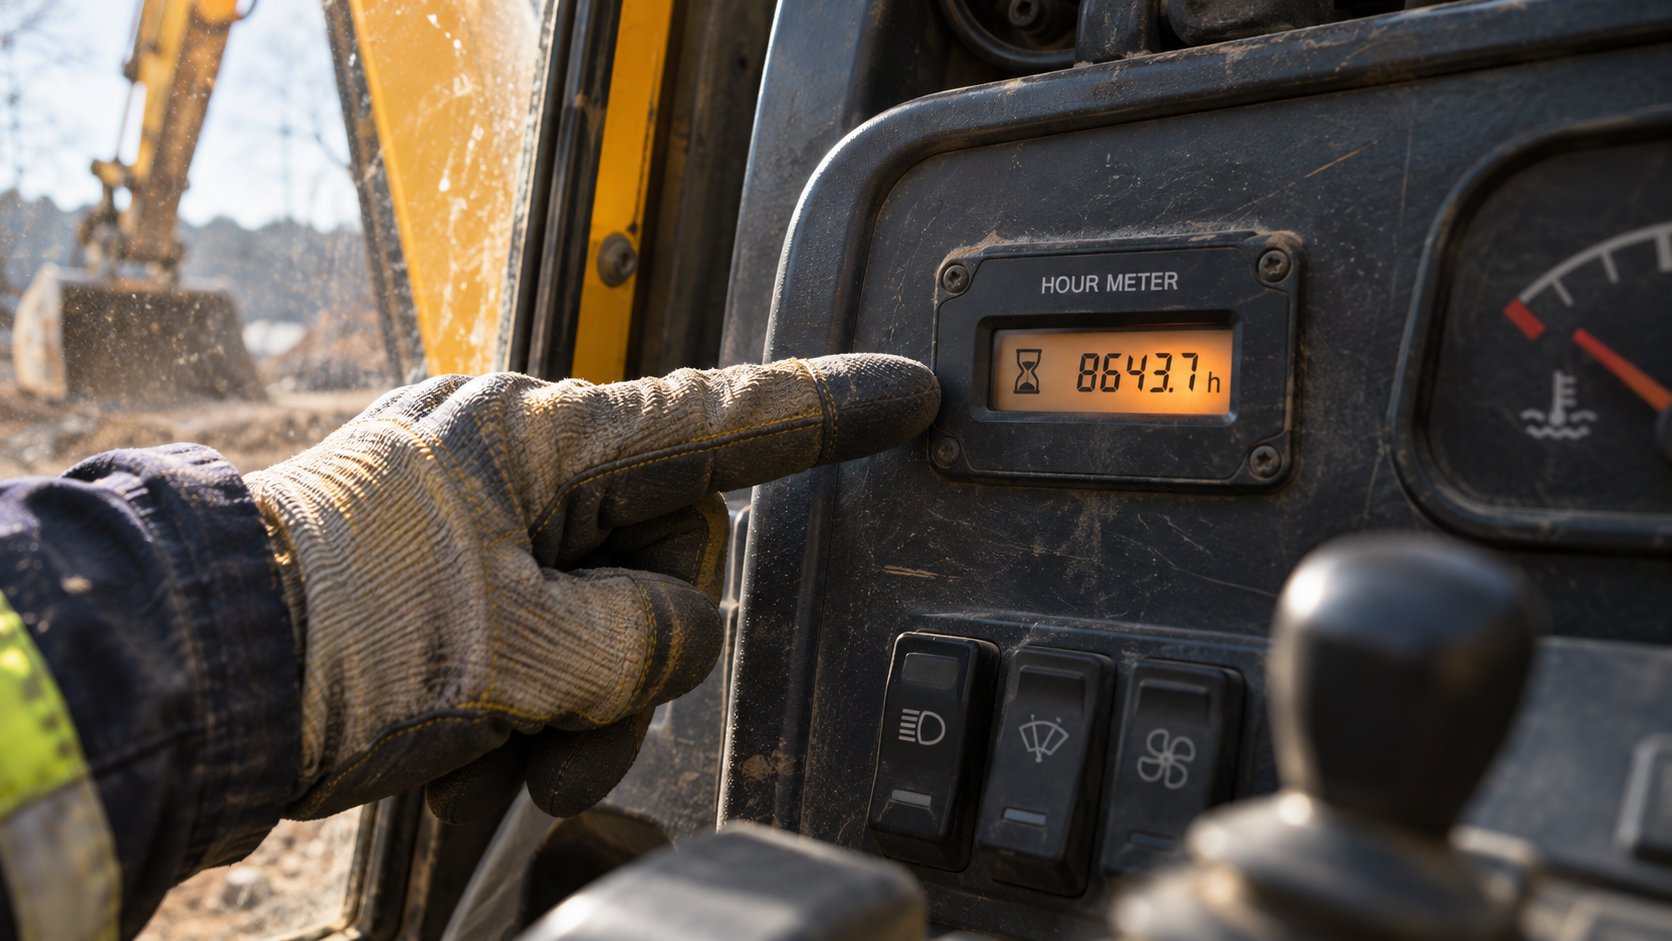
If brand and model set the baseline, hours and condition act as the multipliers that push the final number up or down. Hour-meter readings serve as the primary usage metric for construction equipment, analogous to odometer mileage on a truck. Buyers evaluate age and meter hours together: a 10-year-old excavator with 3,000 documented hours may look more attractive than a 5-year-old machine with 9,000 hours because the lower-hour unit has consumed less of its component life.
General hour thresholds matter, though they shift by category. For many mid-size excavators, value begins to drop more steeply once the meter passes roughly 6,000 to 8,000 hours, the range where major hydraulic and powertrain components start approaching overhaul intervals. Skid steers, which endure harsher duty cycles at lower price points, may see that inflection point arrive earlier. Extremely low hours on an older machine can also raise red flags: long storage periods might lead to seal degradation, stale fluids, or corrosion issues that erode confidence despite the attractive meter reading.
Condition rating layers on top of hours to complete the picture. Industry-standard grading typically follows a four-tier scale:
| Condition Grade | Mechanical Operability | Structural Integrity | Cosmetic Appearance | Tire/Track/Undercarriage Life |
|---|---|---|---|---|
| Excellent | All systems fully functional; no known defects | No cracks, bends, or weld repairs | Minimal wear; original paint largely intact | 80-100% remaining life |
| Good | Fully operational; minor issues that do not affect performance | Sound structure; minor surface wear | Normal wear consistent with age and hours | 50-80% remaining life |
| Fair | Operational but needs near-term repairs or adjustments | Some wear or minor repairs visible | Noticeable dents, fading, or surface rust | 25-50% remaining life |
| Poor | Significant mechanical issues; may not be fully operational | Structural damage or major weld repairs present | Heavy damage, missing panels, or extensive corrosion | Below 25% remaining life |
A machine graded "Excellent" with moderate hours will trade near the top of its value band, while a "Fair" unit at the same hour mark could lose a substantial percentage of that figure. Clean, repaired bodywork, tight pins and bushings, and a tidy cab all signal that the machine has been cared for rather than abused, giving the buyer confidence before committing to a price.
Attachments, Maintenance Records, and Rebuild History
Imagine two identical wheel loaders parked side by side: same brand, same year, same hours. One comes with a thick binder of dated service logs covering every oil change, filter swap, and component inspection. The other comes with a shrug and the phrase, "It ran fine last time we used it." Which one would you pay more for?
Documented maintenance history is a powerful value driver because it replaces guesswork with evidence. Research indicates that excavators with complete maintenance records have sold for an average of 15% more than comparable units without documentation. Records that include service dates, parts used, and the provider responsible for the work let buyers assess risk before they commit, reducing negotiation friction and supporting a stronger asking price.
Certified rebuilds and major component replacements, such as an engine overhaul, new hydraulic pump, or fresh final drives, can partially reset the depreciation clock. A machine with a documented engine rebuild at 10,000 hours effectively starts a new chapter of useful life for that component, and savvy buyers will pay a premium that reflects the remaining service interval rather than the total hours on the frame. Conversely, an undocumented rebuild raises more questions than it answers: was OEM-spec work performed, or was it a budget patch?
Attachments deserve their own line item in any machinery valuation. Buckets, hydraulic thumbs, quick couplers, forks, and specialized tools like compaction wheels or augers can represent a meaningful percentage of a package deal's total worth. Sellers who bundle high-quality attachments without calling them out leave value hidden inside the transaction, while buyers who overlook attachment condition may face surprise replacement costs shortly after purchase.
To tie this framework together, here is a ranked list of factors by their typical impact on used construction equipment values:
- Brand, model, and size class - sets the baseline value band; well-known brands with strong dealer networks hold the widest buyer pools
- Operating hours relative to age - the single most referenced usage metric; directly correlates with remaining component life
- Documented mechanical condition and grading - shifts value within the band established by brand and hours
- Maintenance records and service documentation - proven to support higher sale prices by reducing buyer uncertainty
- Configuration and factory options - high-flow hydraulics, cab packages, and technology upgrades widen the buyer pool
- Rebuild and component replacement history - can partially reset depreciation on major systems when properly documented
- Attachments and accessory packages - add tangible dollar value but are frequently overlooked in pricing discussions
- Cosmetic appearance - influences first impressions and perceived care, though mechanical condition carries more weight financially
This weighted view turns a vague sense of "it depends" into a structured evaluation you can apply to any unit on a lot, in an auction catalog, or listed online. Yet even the most thorough factor analysis only captures a snapshot in time. What it does not show is how quickly each equipment category loses value over the months and years ahead, a pattern shaped by depreciation curves that vary dramatically from excavators to skid steers to cranes.
Depreciation Rates and Curves by Equipment Category
A factor-by-factor snapshot tells you what a machine is worth today. Depreciation tells you where that number is headed tomorrow, next quarter, and five years from now. The tricky part? Depreciation is not one uniform force. It behaves differently depending on how you calculate it and, more importantly, which type of machine you are evaluating. A skid steer and a bulldozer purchased on the same date for similar money can follow wildly divergent value trajectories, and understanding why separates informed machinery valuations from expensive guesswork.
Straight-Line, Declining-Balance, and Hours-Based Depreciation Explained
Three depreciation methods dominate the construction equipment world. Each produces a different book value for the same physical machine, so the method you choose shapes everything from tax filings to internal replacement planning.
Straight-line depreciation is the simplest approach. It spreads the cost of the asset evenly across its estimated useful life, producing identical annual deductions from year one through the final year. The formula looks like this:
Annual Depreciation = (Purchase Price − Salvage Value) ÷ Useful Life in Years
Imagine a machine with a ten-year useful life. Each year consumes exactly the same slice of the original cost, regardless of whether the machine ran 2,000 hours or sat parked for a season. That predictability makes straight-line popular for financial reporting, but it rarely mirrors how construction equipment actually loses value in the real world. Most machines shed value fastest in their early years, not in equal annual increments.
Declining-balance depreciation corrects for that front-loaded reality. Instead of a fixed dollar amount, a fixed percentage is applied to the remaining book value each year. Because the base shrinks annually, the deduction is largest in year one and tapers over time. The formula follows this structure:
Annual Depreciation = Remaining Book Value × Depreciation Rate
This method aligns more closely with market behavior. Industry data shows that roughly 40 to 50 percent of a heavy machine's purchase price can evaporate in the first three years, with annual losses moderating to 8 to 12 percent in years four through six. Declining-balance captures that steep early drop and the gradual flattening that follows, making it a better proxy for resale planning than straight-line.
Hours-based (units-of-production) depreciation ties value loss directly to usage rather than calendar time. The formula works like this:
Depreciation per Hour = (Purchase Price − Salvage Value) ÷ Total Estimated Useful Hours
Then, for any given period:
Period Depreciation = Depreciation per Hour × Hours Operated in That Period
For construction equipment, this is often the most accurate internal method. A machine that runs 400 hours a year depreciates far slower than one logging 2,000 hours annually, even though both age at the same calendar rate. Seasonal contractors who park machines for months at a time benefit most from this approach because it prevents overstating value loss during idle periods. Many fleet managers use declining-balance or accelerated methods for tax reporting while relying on hours-based calculations for internal replacement decisions, essentially running two depreciation tracks on the same asset.
How Depreciation Curves Differ by Equipment Category
Here is where the conversation gets practical. Depreciation is not category-blind. The rate at which a machine loses value depends heavily on what type of machine it is, how the market demands it, and what kind of abuse its duty cycle inflicts. When you plug numbers into an equipment value estimator or consult an equipment values blue book, the outputs reflect these category-level differences, even if they are not always spelled out.
Excavators are the most liquid machines in the used market. High demand across residential, commercial, and infrastructure projects keeps buyer pools large, and that competition supports stronger resale figures. Caterpillar excavators can retain roughly 62 percent of their original value at 5,000 hours, with Komatsu near 58 percent and John Deere around 57 percent. Mid-size units in the popular 20-to-30-tonne class tend to outperform the extremes of the size spectrum. Hours drive the curve more than calendar age: expect roughly 8 to 10 percent of value lost per 1,000 hours in the first 5,000 hours, steepening once the meter crosses the 8,000-to-10,000-hour mark where major component overhauls loom.
Wheel loaders occupy a middle ground. They hold value reasonably well thanks to versatile applications in construction, aggregates, and snow removal, but they lack the extreme liquidity of excavators. Tier-one brands like Caterpillar, Komatsu, and Volvo command the strongest resale numbers. Value retention generally tracks a moderate curve, with depreciation slightly faster than excavators in the same hour range due to harder drivetrain wear in load-and-carry cycles.
Bulldozers are the sleeper category for value retention. Dozers from tier-one brands can hold between 65 and 80 percent of their original value even after 10 years when hours remain moderate and maintenance is documented. The early-year decline mirrors excavators at roughly 20 to 25 percent in year one, but the curve flattens faster, dropping to the 8 to 12 percent annual range by year five. Low-hour dozers are particularly resilient because their core components, especially the powertrain and undercarriage, are built for extreme longevity.
Skid steers follow a steeper depreciation path. Their lower purchase price, harder duty cycles, and higher turnover in rental fleets all compress resale timelines. A mid-frame skid steer can lose 10 to 12 percent of value for every 500 hours, nearly double the per-hour rate of an excavator. Tracked models tend to depreciate more slowly than wheeled models, roughly 12 percent annually versus 15 percent, because tracked units handle a broader range of terrain and applications.
Cranes play by their own rules. Certification and load-test documentation matter more here than in any other category, and a lapsed inspection can crater value regardless of mechanical condition. Liebherr crawler cranes can hold roughly 63 percent of original value at 5,000 hours, while lesser-known brands may depreciate up to 40 percent faster. Boom configuration and capacity rating drive pricing as much as age and hours, making cranes the hardest category to benchmark with a generic calculator.
The table below summarizes these patterns so you can reference them quickly when evaluating a specific unit.
| Equipment Category | Typical Useful Life Range | Primary Depreciation Driver | General Value-Retention Notes |
|---|---|---|---|
| Excavators | 10,000 - 15,000+ hours | Operating hours | Most liquid category; strong demand supports 55-62% retention at 5,000 hours for top brands |
| Wheel Loaders | 10,000 - 14,000 hours | Hours and drivetrain wear | Moderate retention; versatile applications help, but load-and-carry cycles accelerate wear |
| Bulldozers | 12,000 - 18,000+ hours | Hours and undercarriage condition | Strong long-term retention; low-hour units from top brands can hold 65-80% after 10 years |
| Skid Steers | 5,000 - 8,000 hours | Hours and duty-cycle intensity | Fastest depreciation; 10-12% loss per 500 hours; tracked models hold better than wheeled |
| Cranes | 15,000 - 25,000+ hours | Certification, inspection records, and boom configuration | Documentation-dependent; top brands retain 60-63% at 5,000 hours; lapsed certifications sharply reduce value |
Keep in mind that these patterns represent general market behavior for well-known brands under typical operating conditions. Individual machines can deviate significantly based on the weighted factors discussed earlier, especially maintenance documentation and regional demand. If your reference sources or an equipment values blue book provide specific depreciation percentages for a particular make and model, those granular numbers will always outperform broad category averages for pricing a specific unit.
Depreciation curves explain a lot about where value goes over time, but they do not tell the whole story. One increasingly powerful variable sits outside the traditional age-hours-condition triangle entirely: the emissions tier stamped on the engine. That regulatory detail is quietly reshaping the pricing landscape for used iron, creating premium and discount bands that catch uninformed buyers off guard.
How Emissions Tier Standards Shift Resale Pricing
Pull up any equipment blue book or used equipment value calculator, and you will find fields for make, model, year, and hours. What you may not find, at least not prominently, is a field for emissions tier. Yet the EPA classification stamped on that engine dataplate can swing a machine's resale price by thousands of dollars, sometimes in directions that defy expectations. Understanding why requires a quick walk through the regulatory timeline and the engine technologies each tier demands.
Understanding Tier 3, Tier 4 Interim, and Tier 4 Final Standards
The U.S. Environmental Protection Agency rolled out its non-road diesel emission tiers in phases, each one tightening the limits on two key pollutants: nitrogen oxides (NOx) and particulate matter (PM). The European Union followed a parallel path with its Stage standards, and in practice, Tier 4 Final and EU Stage V are considered roughly equivalent in strictness, which is why you often see both listed together on newer spec sheets.
Here is where the engine technology diverges in ways that directly affect equipment cost, maintenance burden, and buyer perception:
- Tier 3 (phased in 2006-2008) - Compliance relied on improved combustion design, electronic fuel injection, and Exhaust Gas Recirculation (EGR). No exhaust aftertreatment hardware was required. These engines are mechanically simpler, familiar to most technicians, and cheaper to maintain.
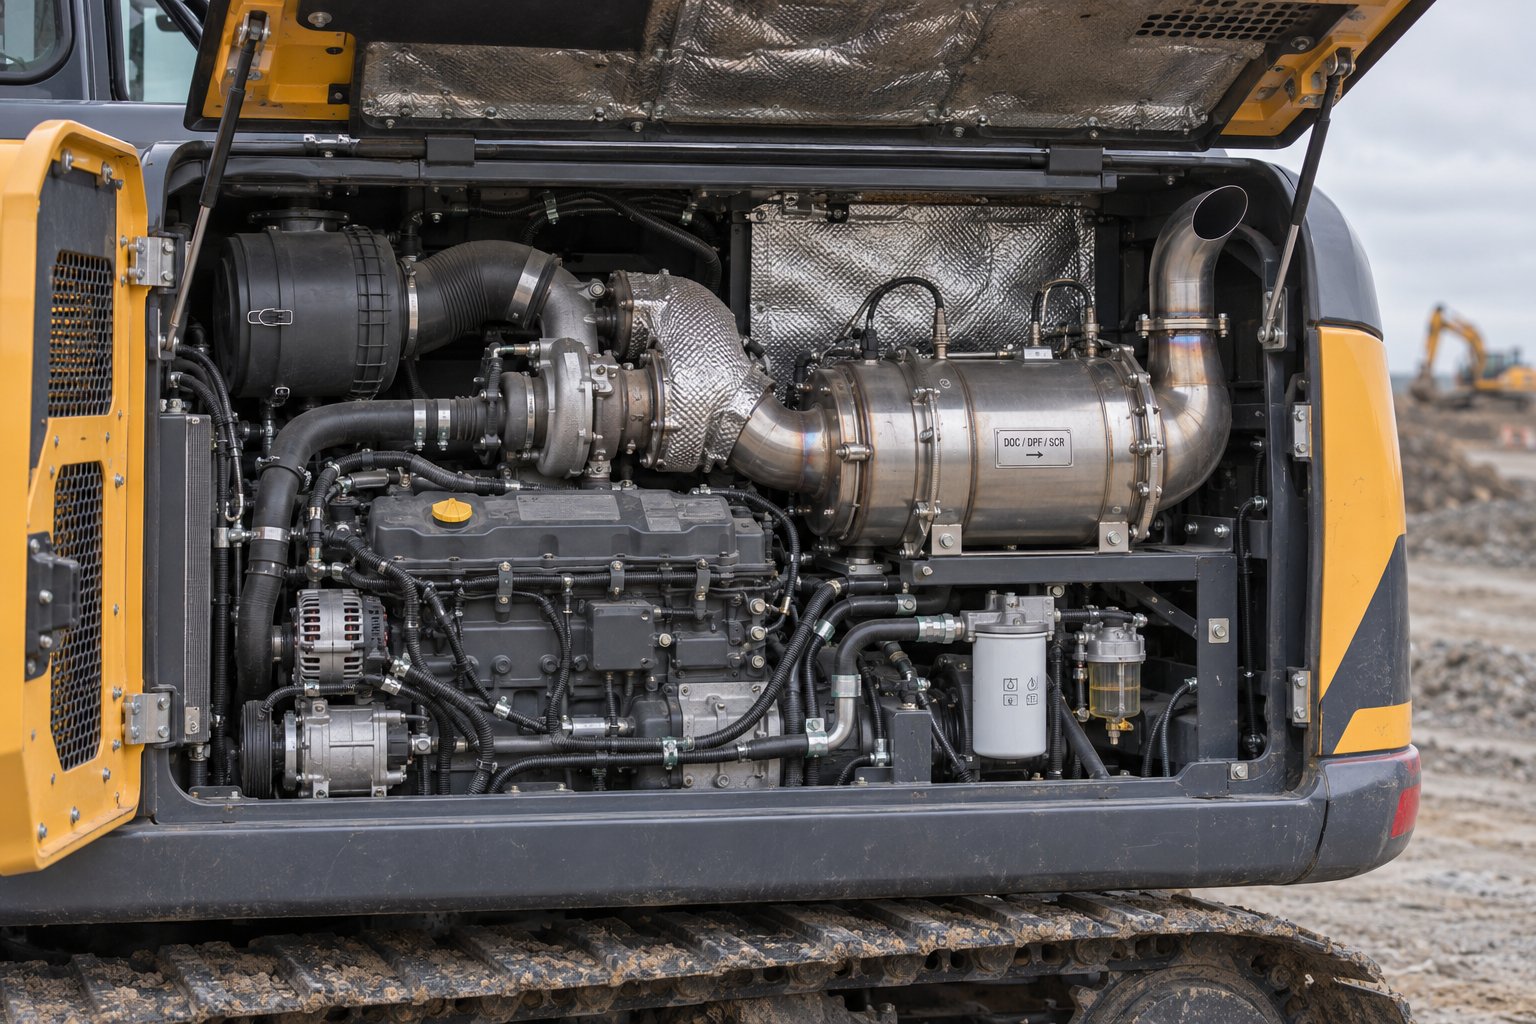
- Tier 4 Interim (2008-2011) - The EPA demanded a sharp reduction in PM emissions, roughly 90 percent below Tier 3 levels. Manufacturers responded by adding Diesel Particulate Filters (DPF) that trap and burn off soot. Some engines also introduced cooled EGR systems and Variable Geometry Turbochargers for tighter NOx control. This was the first generation to carry meaningful aftertreatment hardware.
- Tier 4 Final (2014-2015 onward) - The strictest current U.S. standard requires both DPF and Selective Catalytic Reduction (SCR), which uses Diesel Exhaust Fluid (DEF) to convert NOx into harmless nitrogen and water. Under EPA's Tier standards (40 CFR Part 1039), the PM limit dropped from 0.30 g/kWh under Tier 3 to 0.025 g/kWh under Tier 4 Final, a reduction of roughly 92 percent.
Each step up the tier ladder added aftertreatment components, electronic controls, and fluid requirements. Those additions translate directly into differences in purchase price, ongoing maintenance, and, crucially, resale dynamics.
How Emissions Compliance Reshapes Resale Pricing
You might expect a clean, linear relationship: newer tier equals higher value. Reality is messier, and that messiness creates both traps and opportunities for anyone tracking used construction equipment values.
Tier 4 Final machines command premiums in regulated domestic markets. They meet every current EPA requirement, face no operational restrictions in any U.S. state including California's stricter CARB rules, and are fully financeable and insurable without caveats. Lenders and fleet managers favor them because they are, as one industry framing puts it, future-proofed against further regulatory tightening. Tier 4 Final machines tend to hold their value better in the used market precisely because compliance removes an entire category of buyer risk. When you run these units through a used equipment value calculator, the output reflects that regulatory safety net.
Tier 3 machines occupy a split market. Domestically, they cannot be sold as new equipment, and in states like California they face additional operational phase-out schedules. That regulatory ceiling limits the buyer pool, which in turn compresses prices for U.S. resale. Yet Tier 3 units sometimes hold surprising value in export channels and regions with less stringent regulations. Their mechanically simpler engines, lower maintenance demands, and absence of DPF or DEF requirements make them attractive to buyers in markets where parts availability for aftertreatment systems is limited. Proximity to major ports can actually buoy the resale value of Tier 3 iron.
Early Tier 4 Interim units can get squeezed from both sides. They carry the added complexity of DPF systems, including periodic regeneration cycles and filter replacement costs that can run $2,000 to $8,000 depending on engine size, without the full compliance benefits of Tier 4 Final. Buyers who want simplicity lean toward Tier 3. Buyers who want maximum regulatory protection lean toward Tier 4 Final. That leaves Tier 4 Interim models in a valuation trough, sometimes trading below what their age and hours alone would suggest. DEF consumption adds a recurring operating cost that further dampens enthusiasm, particularly among smaller contractors who are sensitive to incremental expenses.
The practical takeaway? Before you commit to a purchase or set a selling price, verify the exact emissions tier on the engine dataplate, not just the model year. Two machines built in the same calendar year can carry different tier ratings depending on engine power category and production timing. Then assess compliance requirements for your specific operating jurisdiction. A Tier 3 unit might be a smart buy for export or for operation in a region without strict enforcement, but it could become a stranded asset in a market that is tightening regulations.
Emissions tier is an increasingly important, and often overlooked, variable in used construction equipment values. Ignoring it when consulting any equipment blue book or pricing tool means you are missing a factor that can shift resale price by thousands of dollars in either direction.
Emissions compliance adds a regulatory dimension to valuation that pure market data alone cannot capture. But where does that market data come from in the first place? The answer lies in a constellation of valuation tools, subscription databases, and auction platforms, each drawing on different data sources and serving different use cases. Knowing which tool to trust, and when, is its own skill set.
Valuation Tools and Auction Data Sources Compared
Every valuation factor discussed so far, from brand and hours to emissions tier and condition grade, ultimately needs to be translated into a dollar figure. That is where valuation databases and auction platforms come in. Each one draws from a different well of transaction data, serves a different audience, and carries its own blind spots. Relying on a single platform for machine valuation is like checking one weather app before flying across the country: you will get a forecast, but you will not know how reliable it is until you cross-reference.
The problem is that most buyers and sellers do not know which tools exist, what data feeds them, or how their outputs differ. The comparison below fixes that gap.
Major Valuation Databases and What Each Offers
Four primary platforms dominate the valuation of machinery in the construction sector. Each one approaches the question "what is this machine worth?" from a slightly different angle, and understanding those angles helps you pick the right tool for your specific transaction.
EquipmentWatch is a subscription-based platform owned by Informa that aggregates ownership cost data, residual-value forecasts, and rental-rate benchmarks. Its data draws from a combination of dealer transactions, fleet cost surveys, and manufacturer inputs. Fleet managers and lenders lean heavily on EquipmentWatch because its residual-value models project future depreciation, not just current pricing. If you have seen references to an "equipmentwatch login" while researching, this is the platform in question. Its depth makes it the go-to for financial planning, though the subscription cost puts it out of reach for occasional users.
Iron Solutions (IronGuides) publishes valuation guides rooted primarily in dealer transaction data and wholesale market activity. Think of it as the blue-book equivalent for heavy equipment. Dealers, appraisers, and lenders use IronGuides to establish baseline values during trade-in negotiations, loan underwriting, and insurance assessments. Its strength lies in granular make-model-year lookups that adjust for hours and condition, making it particularly useful when you need a quick value-of-machine reference for a specific unit.
Rouse Analytics, now part of RB Global's family of brands, provides rental-rate benchmarks and residual-value data drawn from one of the largest equipment transaction ecosystems in the world. Rouse specializes in fleet analytics, helping rental companies and large contractors understand both current market pricing and forward-looking value trends. Its data underpins many of the free valuation tools offered through affiliated auction and sales platforms.
NADA-style guides are more familiar in the trucking and automotive sectors, but some publishers extend coverage into certain equipment categories such as compact machines, telehandlers, and aerial work platforms. Their data typically blends auction results with dealer input. Coverage for heavy earthmoving equipment is less comprehensive than the platforms above, so treat NADA-style outputs as a supplementary data point rather than a primary source for core construction categories.
| Tool / Platform | Primary Data Source | Cost Model | Best Use Case |
|---|---|---|---|
| EquipmentWatch | Dealer transactions, fleet surveys, manufacturer inputs | Subscription | Residual-value forecasting, ownership cost analysis, lender underwriting |
| Iron Solutions (IronGuides) | Dealer and wholesale transaction data | Subscription / per-report | Trade-in pricing, loan collateral checks, certified appraisals |
| Rouse Analytics | Auction and marketplace transaction data across RB Global channels | Subscription / enterprise | Fleet benchmarking, rental-rate analysis, residual-value trends |
| NADA-style Guides | Auction results and dealer inputs (coverage varies) | Subscription / per-lookup | Supplementary reference for compact equipment and trucks |
No single platform captures the full picture. EquipmentWatch excels at forecasting but may lag behind real-time auction spikes. IronGuides reflects dealer-level pricing but not the discount you might find in a private-party deal. Rouse captures massive transaction volume yet skews toward auction and liquidation price points. Using at least two sources in tandem gives you a far more reliable range for any machine valuation exercise.
How to Read and Interpret Auction Results Data
Publicly available auction results from major houses offer one of the most transparent windows into what buyers are actually paying, not asking, for used iron. Platforms like Ritchie Bros. sell hundreds of thousands of equipment items annually, and much of that transaction data is searchable online. Here is a step-by-step process for turning raw auction results into actionable intelligence:
- Filter by make, model, year range, and hour range. Start broad, then narrow. Looking at a 2018 Cat 320 with 4,500 hours? Pull results for 2017-2019 Cat 320 models between 3,000 and 6,000 hours to build a meaningful sample.
- Focus on sold prices, not asking prices. Listings on classified sites show what sellers hope to get. Auction hammer prices show what buyers actually agreed to pay. That distinction matters enormously when establishing realistic market expectations.
- Account for the buyer's premium. The hammer price is not the buyer's final cost. Auction houses add a buyer's premium, typically ranging from 10 to 18 percent for equipment, on top of the winning bid. If a machine hammered at $85,000 and the premium is 15 percent, the buyer's actual base cost was $97,750 before taxes and removal. When comparing auction data to private-sale or dealer pricing, add the premium back in to create an apples-to-apples comparison.
- Note the sale date. A result from 18 months ago may not reflect today's market. Seasonal demand, infrastructure spending cycles, and supply fluctuations can shift values meaningfully over even a few quarters. Weight recent sales more heavily than older ones.
- Check geographic context. A machine sold near a booming construction corridor may have fetched a premium driven by local demand rather than broader market value. Conversely, a unit sold in a softer regional market may understate what it would bring elsewhere.
One critical caution: auction prices generally represent liquidation-level value, meaning the lower end of the pricing spectrum discussed in the valuation-types chapter. A machine that hammered at $70,000 at auction might carry a fair market value closer to $80,000-$90,000 in a private sale and a dealer retail price north of $95,000. Treating the hammer price as the definitive value of machine ignores the transaction-context lesson at the heart of this guide.
The smartest approach combines industrial equipment price comparables from multiple sources, a subscription database for baseline ranges, auction results for real-world floor pricing, and dealer listings for the retail ceiling. That triangulation gives you a defensible range rather than a single fragile number.
Data tools and auction records reveal what the market has done, but they do not always explain why two identical machines sold at different prices in different states. That geographic dimension introduces its own set of forces, from regional construction booms to seasonal demand swings, that can widen or compress the value range a tool suggests.

Regional Price Swings and the Equipment Sweet Spot
A 2019 excavator with 5,000 hours does not care whether it sits in Houston or Boise. Its mechanical condition is identical in both cities. Its resale price, however, is not. Geography introduces a layer of pricing variance that no tractor valuation calculator or subscription database fully captures on its own, and ignoring it is one of the fastest ways to misstep on equipment values. The same forces that make real estate prices vary from coast to coast, namely local demand, seasonal cycles, and access to buyers, apply just as powerfully to used iron.
Why the Same Machine Sells for Different Prices Across Regions
Imagine two contractors shopping for the same model wheel loader on the same day. One is bidding in a market near a freshly funded highway corridor where every grading subcontractor needs machines yesterday. The other is browsing listings in a region where a construction slowdown has flooded dealer lots with surplus inventory. The first buyer faces inflated prices driven by scarcity and urgency. The second finds softened asking prices because sellers outnumber buyers. The machine itself has not changed; the local supply-and-demand equation has.
Several regional dynamics create this kind of price variance:
- Proximity to major infrastructure projects. When a state announces a multi-billion-dollar highway, bridge, or transit program, local demand for dozers, excavators, and graders surges. Sellers in that corridor can command premiums because contractors need machines immediately and cannot wait for shipping from out of state. Regional project cycles can cause heavy equipment prices to skyrocket as newly awarded government contracts create urgency in the buyer pool.
- Seasonal weather patterns. Areas with harsh winters experience predictable price swings. Earthmoving equipment often dips in value heading into late fall as outdoor work slows, then rebounds in early spring when contractors ramp up for the building season. Snow-removal-capable loaders and backhoes, on the other hand, may see their demand peak in reverse. Buying a machine during the off-season for its primary application, such as picking up a compaction roller in December, frequently yields a lower price than waiting until the spring rush.
- Port proximity and export demand. Markets near major shipping ports see an additional buyer layer that most inland markets do not: international exporters. As discussed in the emissions-tier chapter, Tier 3 machines that face regulatory ceilings domestically can hold surprising value when export buyers are competing for them. Older, high-emission machines are highly sought after in regions with less strict regulations, such as parts of Africa, South America, and the Middle East, and that demand flows back through coastal auction yards and dealer networks.
- Rural versus urban inventory concentration. Urban markets tend to carry broader inventory selections and larger buyer pools, which generally keeps pricing competitive. Rural markets may have fewer machines available locally, pushing prices up for in-demand categories, but they can also harbor undervalued equipment from small operators who lack the marketing reach to attract a wide audience.
Transportation costs add a hidden equalizer to these regional gaps. A machine listed several states away at an attractive price may not be a bargain once you factor in freight. Shipping costs depend on machine dimensions, trailer type, distance, and whether loading assistance or disassembly is required, and for oversize loads that exceed legal dimensions, permits and escort fees can push the total freight bill into five figures. A $5,000 regional discount disappears fast when the transport quote comes back at $7,500. Smart buyers always calculate the total landed cost, purchase price plus freight plus any import or compliance fees, before committing to an out-of-market deal.
The practical lesson here is straightforward: always benchmark equipment value against comparable listings in at least two or three geographic regions. A machinery & equipment valuation that only considers local comps may overstate or understate the true market picture, depending on which direction your regional dynamics are pulling.
Finding the Sweet Spot in Age, Hours, and Value
Regional awareness tells you where to look. The sweet-spot concept tells you what to look for. Every machine traces an arc from expensive new-unit premium to bargain-bin territory, and somewhere along that arc sits a window where the ratio of remaining useful life to acquisition cost is at its most favorable. Buying inside that window is one of the most effective strategies for maximizing the equipment value you receive per dollar spent.
The sweet spot typically opens after the steepest phase of early depreciation has passed. Most standard machines lose between 20 and 40 percent of their original retail price during the first year, with an additional 10 to 15 percent annual decline in the years immediately following. By the time a machine reaches roughly three to five years of age, the first owner has absorbed the sharpest value hit, yet the core components, engine, hydraulic system, drivetrain, still have substantial service life remaining.
The window closes when major component overhauls become imminent. Most equipment hits its optimal cost-efficiency range between 2,000 and 8,000 operating hours, a stage where the machine is broken in, maintenance costs are predictable, and hourly operating expenses remain reasonable. Beyond roughly 8,000 to 12,000 hours, depending on the category, hydraulic pumps, final drives, undercarriage components, and engines start approaching overhaul thresholds. The price may look tempting, but the hidden rebuild costs waiting around the corner can erase the perceived savings in a single repair invoice.
The exact sweet-spot window shifts by equipment type. An excavator with strong brand support and high market liquidity may stay in the zone longer than a skid steer that depreciates rapidly under punishing duty cycles. A well-documented dozer with moderate hours can offer an exceptionally long sweet spot thanks to the category's strong value retention. The key is recognizing the pattern, not memorizing a single number.
Here is what a sweet-spot machine typically looks like in practice:
- Past the steep early depreciation curve - The first owner has already absorbed 30 to 50 percent of the original price, meaning your entry point carries far less embedded loss risk.
- Documented maintenance history - Service records confirm that scheduled intervals were followed, reducing the uncertainty that forces buyers to discount their offers.
- Major components still within expected service intervals - Engine, hydraulic pumps, final drives, and undercarriage should have meaningful life remaining before overhaul territory, validated by hour-meter readings and inspection.
- Emissions compliance appropriate for the buyer's market - The machine meets the regulatory requirements of the jurisdiction where it will operate, avoiding compliance-related value erosion or operational restrictions down the road.
- Configuration that matches a broad range of applications - Standard buckets, common coupler systems, and versatile hydraulic setups keep the machine easy to redeploy or resell when the time comes.
Contractors who consistently buy in the sweet spot build fleets with lower average capital cost per operating hour, better uptime reliability, and stronger residual values when it comes time to rotate machines out. Conversely, chasing rock-bottom prices on high-hour equipment often leads to what fleet managers call the "one more year" trap, where keeping a machine past its optimal point can cost 20 to 30 percent more than a planned replacement once you tally unplanned downtime, emergency repairs, and lost productivity.
Knowing where to shop geographically and what age-hour profile to target are powerful advantages. But even armed with regional data and the sweet-spot framework, buyers and sellers still stumble into a handful of recurring mistakes that quietly erode thousands of dollars from every transaction.
Common Valuation Mistakes That Cost Thousands
You have the valuation frameworks, the depreciation curves, the regional awareness, and the sweet-spot concept locked in. Yet none of that knowledge protects you if you fall into one of the traps that quietly drain money from equipment transactions every single day. These are not obscure edge cases. They are patterns that repeat across dealer lots, auction floors, and private sales with alarming regularity, and each one is entirely avoidable once you know what to watch for.
Here are the most expensive pitfalls, ranked by how frequently they appear and how much damage they inflict.
- Anchoring to the original purchase price
- Ignoring the value of attachments
- Relying on a single data source
- Mistaking a purchase quote for a professional appraisal
- Skipping emissions-tier verification
- Overlooking total landed cost when buying out of region
Each one deserves a closer look.
Overpaying by Anchoring to Original Purchase Price
Imagine you bought a mid-size excavator five years ago for $280,000. Today, a buyer offers $145,000. Your gut reaction? That number feels wrong. It should be worth more, right? You paid nearly double.
This is anchoring bias in action, and it is the single most common pricing mistake in the used equipment market. Valuing a machine based on what you paid for it years ago, rather than what the market pays today, ignores every force that has acted on the asset since you signed the original invoice. Depreciation has eroded value. Technology has advanced. Emissions regulations may have shifted the compliance landscape. Market supply and demand have fluctuated with infrastructure spending cycles and seasonal patterns.
The original purchase price is a historical fact, not a valuation tool. A heavy equipment value tracker or any credible valuation database prices a machine based on current comparable transactions, not on what someone once paid at a dealer counter. Sellers who anchor to their purchase price overprice their listings and watch machines sit unsold for months, accumulating insurance, storage, and opportunity costs. Buyers who anchor to the seller's original cost may accept an inflated asking price without questioning whether the market supports it.
The fix is straightforward: treat the original cost as irrelevant to the current transaction. Start fresh with today's comparable data every time.
Ignoring Attachment Value and Relying on a Single Data Source
Attachments are the silent value leak in equipment deals. A hydraulic thumb, a set of specialty buckets, a quick coupler, pallet forks, or an auger kit can represent a meaningful percentage of a package deal's total worth, yet both buyers and sellers routinely treat them as afterthoughts. Sellers bundle high-quality attachments into a listing without itemizing them, effectively giving away hundreds or thousands of dollars in unrecognized value. Buyers, meanwhile, focus entirely on the base machine and discover post-purchase that replacements for worn or missing attachments carry steep price tags.
Excavator attachments alone span buckets, hydraulic hammers, thumbs, augers, grapples, compactors, and rippers, each one designed for a specific task and each one carrying its own replacement cost. A quality hydraulic breaker for a 20-ton excavator can cost several thousand dollars. A set of matched digging and grading buckets adds real dollar value to any transaction. If you are evaluating a machine package and the listing says "includes attachments," ask for a detailed list with condition notes. If you are selling, itemize every attachment with approximate replacement cost so the buyer understands the full value they are receiving.
Equally damaging is the habit of relying on a single data source to set or validate a price. One auction result, one online equipment appraisal tool, or one dealer's asking price gives you a data point, not a trend. Auction prices reflect liquidation-level value. Dealer listings reflect retail ceilings padded with reconditioning and margin. A farm equipment price evaluator or factory equipment valuation guide may draw from a different transaction pool entirely. Any one of these in isolation can mislead you in either direction.
The remedy is simple: cross-reference at least two to three independent data sources before settling on a number. Pull auction results for floor pricing, check a valuation guide like IronGuides or EquipmentWatch for mid-range benchmarks, and scan dealer listings for the retail ceiling. When those three data points converge into a range, you have a defensible basis for negotiation. When they diverge sharply, that divergence itself is a signal worth investigating, perhaps the machine has a regional demand anomaly or a specification quirk that one source captures and another misses.
Mistaking a Quote Request for a Professional Appraisal
Here is a scenario that plays out more often than you might expect. A contractor emails three dealers asking, "What would you give me for this machine?" The responses come back: $110,000, $95,000, and $105,000. The contractor picks the highest number, calls it the machine's value, and uses it in a loan application or an insurance claim. The lender or insurer pushes back, and suddenly the transaction stalls.
A purchase quote from a dealer or any supplier is a market data point. It reflects what that particular buyer is willing to pay under their specific circumstances, factoring in their current inventory needs, reconditioning capacity, and margin targets. It is useful information, but it is not a certified equipment appraisal.
A certified appraisal is a formal, documented opinion of value prepared by an accredited appraiser, typically credentialed through bodies like the American Society of Appraisers (ASA) or the Royal Institution of Chartered Surveyors (RICS). The appraiser follows recognized methodology, states the purpose and definition of value being applied, and produces a written report that can withstand legal and financial scrutiny. Appraisals may involve a desktop analysis based on market data and documentation, or a physical site visit where the appraiser inspects the equipment firsthand. SBA 504 loans specifically require an on-site inspection by a qualified, independent appraiser, while 7a loans offer more flexibility.
When do you actually need a formal appraisal rather than a collection of market quotes? Common triggers include:
- Insurance claims - Insurers often require a certified valuation to process a total-loss or major-damage claim.
- Litigation and dispute resolution - Courts expect credentialed, documented opinions of value, not dealer quotes.
- Estate settlements and business dissolutions - Dividing assets fairly demands an independent, defensible number.
- SBA and USDA lending - Government-backed loan programs have specific appraisal requirements that dealer quotes cannot satisfy.
- Tax disputes or IRS audits - A certified appraisal provides the documentation trail needed to support claimed values.
Appraisal costs vary based on the number of assets, complexity, and whether a site visit is required. Desktop appraisals for straightforward, standardized equipment tend to fall at the lower end of the fee spectrum, while site-visit appraisals for complex or specialized machinery cost more due to travel and inspection time. The investment is modest relative to the financial exposure of getting a valuation wrong in a legal or lending context.
The bottom line: gather dealer quotes and online data points freely, they sharpen your market sense. But when the stakes are high, whether you are defending a number in court, securing a six-figure loan, or filing an insurance claim, invest in a credentialed appraisal that carries the weight the situation demands.
Avoiding these mistakes is largely a matter of discipline: reset your mental anchor with fresh data, itemize every component of value in a deal, triangulate across multiple sources, and know when a professional opinion is worth the fee. That discipline becomes even more powerful when you channel it into a structured workflow, a step-by-step checklist you can run before any buy or sell decision to ensure nothing slips through the cracks.

Turning Valuation Knowledge Into Smarter Equipment Decisions
Frameworks, depreciation curves, emissions tiers, regional dynamics, and pitfall awareness are powerful individually. Combined into a repeatable workflow, they become the difference between walking into a transaction hoping for a fair deal and knowing you have one. The checklist below distills everything covered in this guide into a sequence you can run before every buy or sell decision, whether the machine in question is a $30,000 skid steer or a $300,000 crawler excavator.
Building Your Valuation Checklist Before You Buy or Sell
Think of this as your pre-flight inspection for any equipment transaction. Skip a step and you risk leaving money behind, overpaying, or basing a major financial decision on incomplete information. Run through every step and you negotiate from a position of strength regardless of which side of the deal you sit on.
- Identify the correct valuation type for your transaction context. Are you selling privately (fair market value), trading in at a dealer (trade-in value), listing at auction (liquidation value), or filing an insurance claim (replacement value)? The number you need depends entirely on the context. Quoting the wrong type is where confusion starts.
- Gather comparable data from at least two independent sources. Pull auction results for floor pricing, check a subscription database like EquipmentWatch or IronGuides for mid-range benchmarks, and scan dealer listings for the retail ceiling. When these converge, you have a defensible range. When they diverge, dig deeper to understand why.
- Verify emissions-tier compliance for your operating region. Check the engine dataplate for the exact tier rating, not just the model year. Confirm the machine meets regulatory requirements where you plan to operate it. A Tier 3 unit headed for a CARB-regulated California jobsite is a compliance headache waiting to happen, while the same machine bound for export may carry a premium.
- Inspect condition against standard grading criteria. Walk the machine using the Excellent/Good/Fair/Poor framework: mechanical operability, structural integrity, cosmetic appearance, and tire or track or undercarriage remaining life. Document everything with photos and notes so your condition assessment is defensible, not subjective.
- Evaluate operating hours relative to age and category norms. Cross-reference the hour meter against the typical useful-life ranges for that equipment type. A machine sitting in the sweet spot, past steep early depreciation but before major overhaul territory, offers the best ratio of remaining life to acquisition cost.
- Itemize attachments and request maintenance documentation. List every attachment with its approximate replacement cost. Ask for service records, rebuild documentation, and component replacement history. Machines with complete records consistently command higher prices, and undocumented units deserve a corresponding discount.
- Factor in regional pricing dynamics and total landed cost. Benchmark against listings in two or three geographic markets. If the machine is out of state, get a freight quote before committing. Add transport, permits, and any compliance fees to calculate the true total cost of acquisition.
- Determine whether a certified appraisal is required. If the transaction involves lending, insurance claims, litigation, or estate settlement, a dealer quote is not enough. Engage an ASA- or RICS-credentialed appraiser to produce a formal opinion of value that carries legal and financial weight.
Print this list, save it to your phone, or pin it to the wall of your shop. The few minutes it takes to run through each step before a transaction can save thousands of dollars and weeks of frustration after one.
Where to Compare Used Excavators, Loaders, Bulldozers, and Graders
A valuation checklist tells you what a machine should be worth. The next move is finding actual available inventory and testing those numbers against real asking prices. How much is this machine worth in theory matters far less if you cannot locate comparable units to validate your range or find the right piece of iron for your project timeline.
Several sourcing channels deserve a place in your search rotation:
- Auction platforms offer the broadest selection and the most transparent pricing through published sold results. They are ideal for benchmarking and for buyers comfortable with as-is purchases at liquidation-level pricing.
- Dealer networks provide reconditioned machines, often with limited warranties and financing options. You pay a retail premium, but you gain risk reduction and after-sale support.
- Classified and marketplace listings connect private sellers directly with buyers, often at prices between auction and dealer retail. Due diligence responsibility falls squarely on the buyer.
- Specialized equipment suppliers curate inventories around specific machine types and buyer needs. Suppliers such as JIUHONG offer online collections of used excavators, loaders, bulldozers, and graders where contractors, fleet managers, and equipment dealers can compare machinery specifications and request purchase quotes for upcoming projects.
A quick editorial note worth repeating: a purchase quote from any supplier, whether a local dealer, an auction house, or an online equipment provider, is a market data point. It reflects that seller's pricing under their specific circumstances. It is not a certified appraisal. Always cross-reference any quote against the valuation tools and comparable-data methods discussed throughout this guide to confirm the number falls within a reasonable range.
Comprehensive market coverage means checking multiple channels. An excavator listed on one platform at a particular price might appear on another for significantly less, or it might be absent entirely, leaving you unaware of better options. Casting a wide net across auctions, dealers, classifieds, and specialized suppliers ensures you see enough of the market to make an informed decision rather than settling for the first option that appears.
The used equipment trade-in value a dealer offers you today, the auction hammer price from last month, and the asking price on an online listing right now are all pieces of the same puzzle. None of them alone answers the question with certainty. Together, filtered through the checklist above and weighted by the factors this guide has unpacked, they form a picture clear enough to act on with confidence.
Understanding value before shopping is the single most effective way to avoid overpaying and negotiate from a position of strength.
Every dollar of overpayment you avoid goes straight to your bottom line. Every dollar of underpricing you prevent stays in your pocket instead of enriching the next buyer. The equipment value calculator, the auction database, and the depreciation curve are just tools. The real advantage belongs to the person who knows how to use them together, and that person, after reading this guide, is you.
Frequently Asked Questions About Used Construction Equipment Values
1. How do I find the fair market value of used construction equipment?
Start by identifying the correct valuation type for your situation, whether that is fair market value for a private sale or liquidation value for an auction. Then cross-reference at least two independent data sources such as EquipmentWatch, Iron Solutions (IronGuides), recent auction sold prices, and dealer retail listings. Filter comparables by make, model, year range, hour range, and condition grade. When auction data is used, remember to add the buyer's premium, typically 10 to 18 percent, to the hammer price for an accurate comparison. This triangulation approach gives you a defensible value range rather than a single fragile number.
2. What factors affect used construction equipment values the most?
Brand reputation and model popularity set the baseline value band, with manufacturers like Caterpillar, Komatsu, and John Deere consistently commanding higher resale prices due to strong dealer networks and parts availability. Operating hours relative to age act as the primary usage metric and directly correlate with remaining component life. Documented mechanical condition, verified through industry-standard Excellent/Good/Fair/Poor grading, shifts value within that band. Maintenance records, emissions-tier compliance, configuration and factory options, rebuild history, attachment packages, and regional market demand all layer additional influence. Machines with complete service documentation have been shown to sell for roughly 15 percent more than comparable undocumented units.
3. How fast does construction equipment depreciate?
Depreciation rates vary significantly by equipment category. Industry data suggests that heavy machines can lose 40 to 50 percent of their purchase price within the first three years, with annual losses moderating to 8 to 12 percent in years four through six. Excavators from top brands may retain 55 to 62 percent of value at 5,000 hours, while skid steers depreciate faster at roughly 10 to 12 percent per 500 hours due to harsher duty cycles. Bulldozers are strong long-term holders, with low-hour units from tier-one brands retaining 65 to 80 percent after a decade. Hours-based depreciation, which ties value loss directly to usage rather than calendar time, is often the most accurate method for construction machines that may sit idle seasonally.
4. Does the EPA emissions tier affect used equipment resale prices?
Yes, and the impact is more nuanced than newer-equals-better. Tier 4 Final machines command domestic premiums because they meet all current EPA and CARB requirements, making them fully financeable and operationally unrestricted. Tier 3 machines face a split market: compressed domestic values due to regulatory ceilings, yet sometimes surprising strength in export channels where simpler engines and lower maintenance costs are preferred. Early Tier 4 Interim units can get squeezed from both sides, carrying aftertreatment complexity without full Tier 4 Final compliance benefits. DPF replacement costs alone can range from $2,000 to $8,000 depending on engine size. Always verify the exact tier on the engine dataplate before finalizing any purchase or sale price.
5. What is the best time to buy used construction equipment to get the lowest price?
Timing your purchase around seasonal and regional demand cycles can yield meaningful savings. Earthmoving equipment often dips in value during late fall and winter when outdoor construction slows, then rebounds in spring as contractors ramp up. Buying during the off-season for a machine's primary application, such as purchasing a compaction roller in December, frequently results in a lower price. Beyond seasonal timing, targeting the value sweet spot in a machine's life cycle delivers the best ratio of remaining useful life to acquisition cost. This window typically falls between three and five years of age and roughly 2,000 to 8,000 operating hours, after the steepest early depreciation but before major component overhauls become imminent. Suppliers like JIUHONG (https://jiuhong-machinery.com/products/) let you browse used excavators, loaders, bulldozers, and graders online to compare specs and request quotes, which you can then benchmark against auction results and valuation guides.